
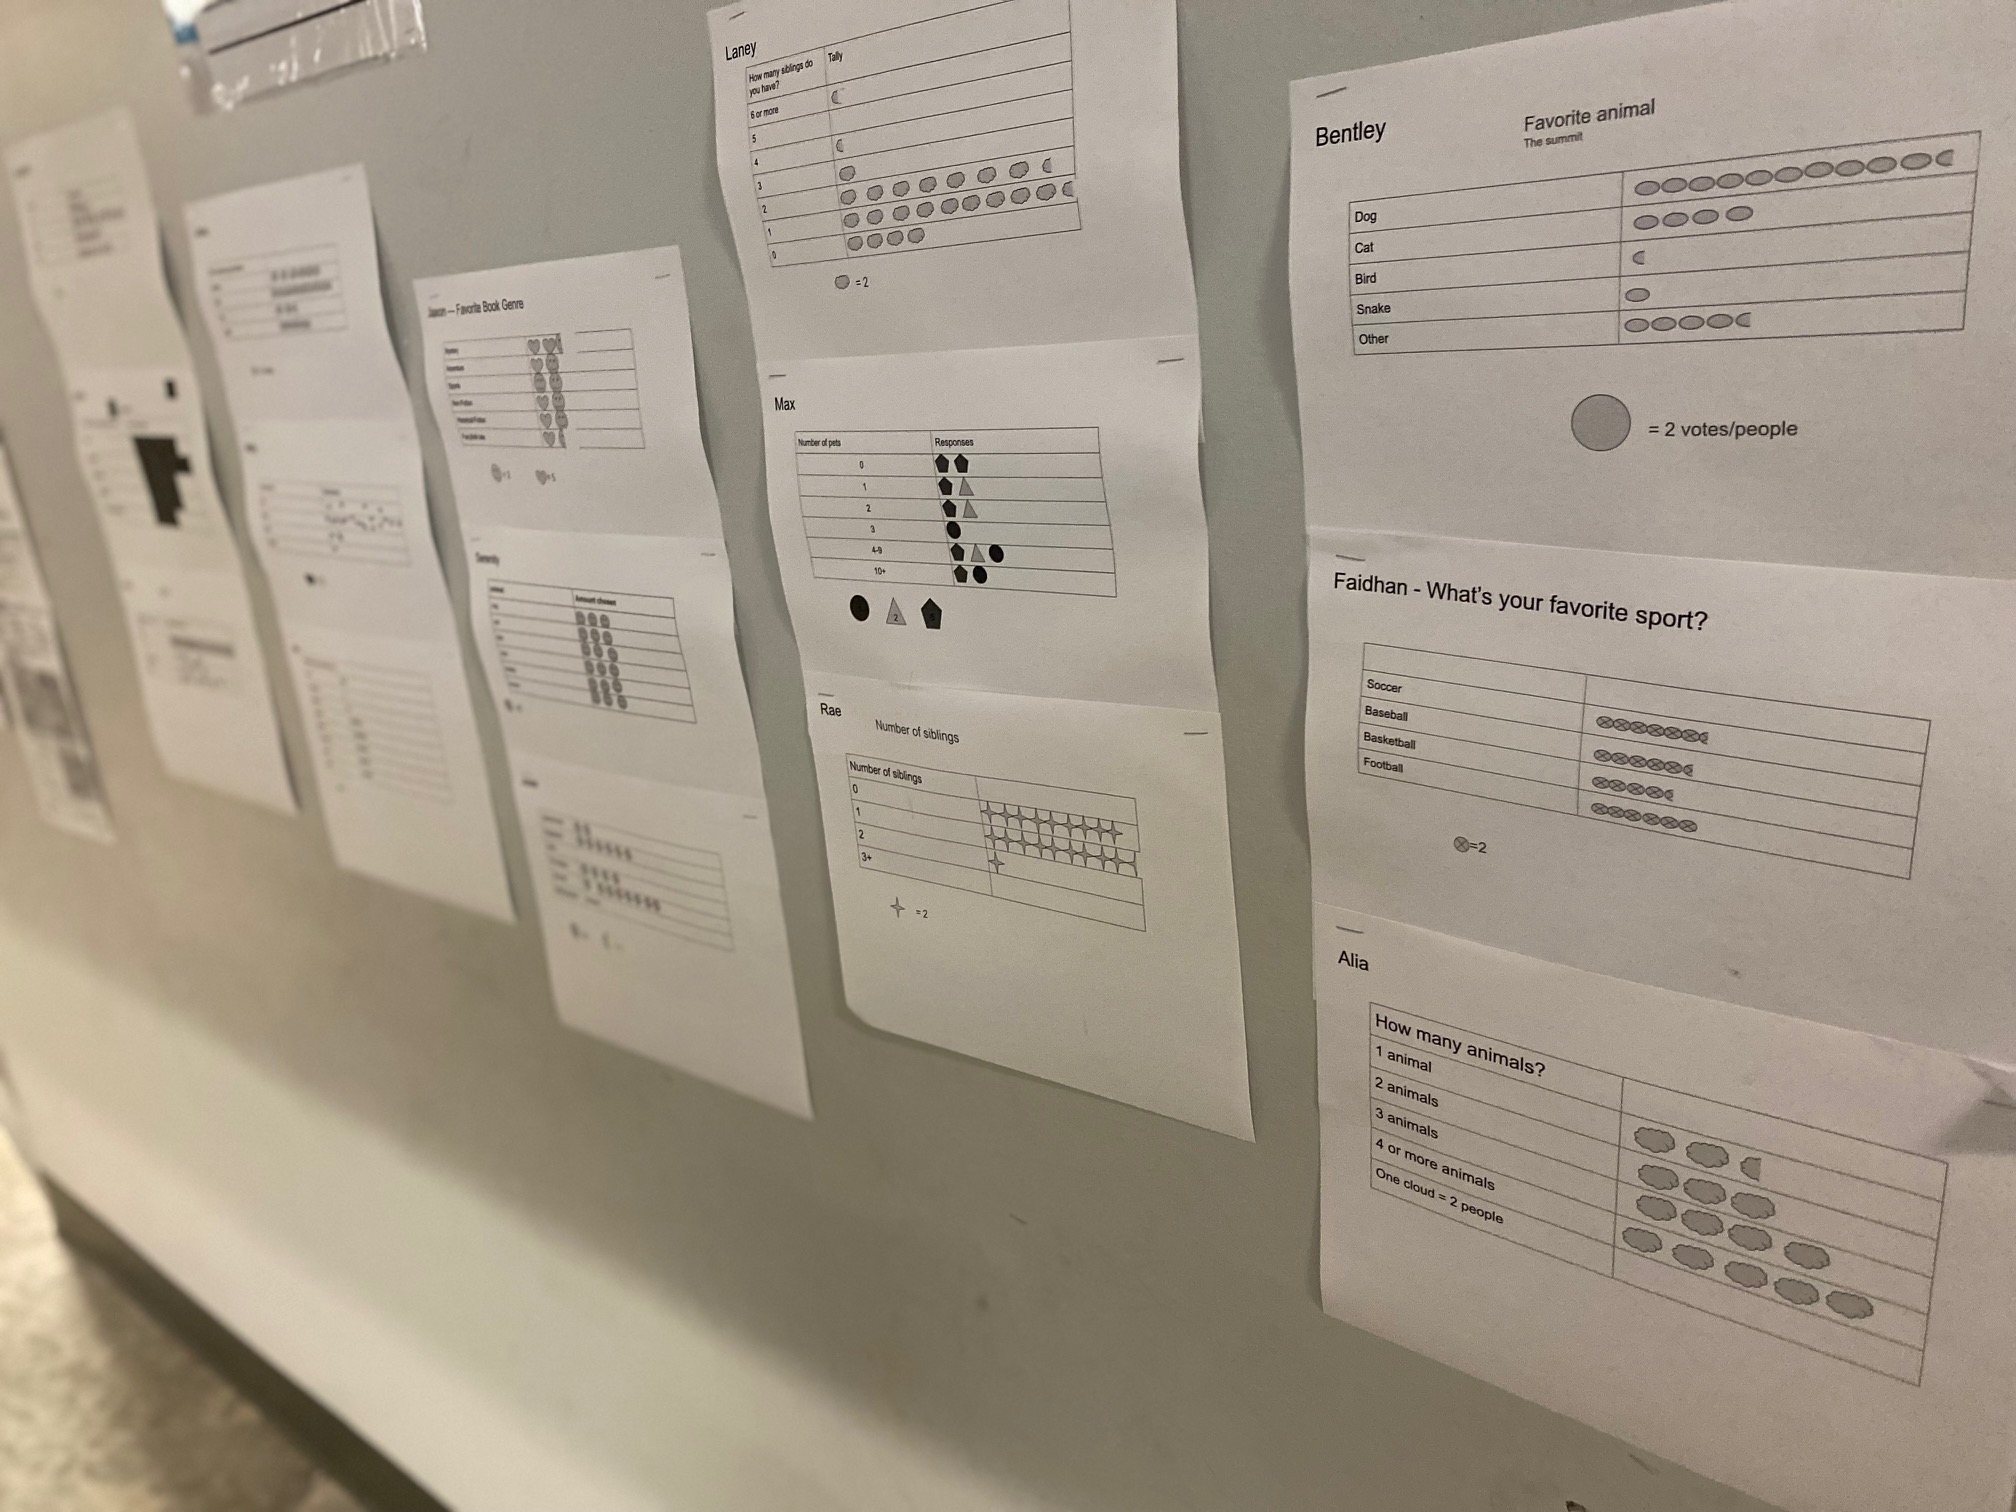
This week in science, the students were learning about different types of graphs. On Tuesday, fifth graders chose a question on a range of topics from favorite color to number of siblings to favorite ice cream flavor. They created a frequency chart and polled Summit students and teachers to gather data. On Wednesday, they used GoogleSlides to create a pictograph based on the data they gathered. When you get a chance, you can see them in the 5th grade hallway – you can learn a lot about our community!
Additionally this week, fifth graders got to go bowling in PE! Here are some pictures!